


COVID-19 day 168: 📈 2,936,077 cases; 130,306 deaths : 06 July 2020
US 7-day average continues to rise (48,385), just like it has every day since 15 June; today's daily report is down slightly from Sunday (like most Mondays)


It’s day 168 since the first case of coronavirus disease was announced in the United States. A just-the-numbers issue. On 15 June, the 7-day average (using Johns Hopkins data) was 21,458, down slightly from the day before. The 7-day average had been skating along between 20,000 and 22,000 for more than a month, moderating daily variation due to reporting delays and reduced testing on weekends..
On 16 June, it jumped to 22,104. On 17 June, 22,985. And each day since, the 7-day average has gone up, not down. Today it was 48,385, more than twice as many as 22 days ago.
🦠 Monday, Johns Hopkins reported 2,936,077 (47,442 new) cases and 130,306 (359 new) deaths, an increase of 1.64% (1.73%) and 0.28% (0.21%), respectively, since Sunday (Saturday). A week ago, the daily numbers increased by 1.63% and 0.27%, respectively.
The seven-day average: 48,385 ⬆️ (47,289) cases and 563 ⬆️(551) deaths
Percent of cases leading to death: 4.44% ⬇️ (4.50%).
Today’s case rate is 887.03 per 100,000; the death rate, 39.36 per 100,000.
One week ago, the case rate was 758.35 per 100,000; the death rate, 37.93 per 100,000.
Note: numbers in (.) are from the prior day and are provided for context. I include the seven-day average because dailies vary so much in the course of a week, particularly over a weekend.
🤓 Recommended reading
There will be mountains of dissertations focused on “why” we ignored public health guidance and “how” to prevent another catastrophe in the future.
[O]ur inability to act early and preventively….reminds me of the fable about the ant and the grasshopper. In it, the ant works prudently all summer and is prepared when winter hits, while the grasshopper lives it up during times of warmth and abundance only to suffer when things freeze up.
Why were we so late responding to Covid-19? Blame it on our culture and brains. STAT News, 06 July 2020.
🔬 Research and medical news
The reported global recovery rate (Johns Hopkins) for COVID-19 today was 54%.
The US reported recovery rate: 31.5%.
On 06 June, it was 44.8% compared to 26.1%.
Why is the US recovery rate so much lower than the global rate?
“We just don't have the data because we don't have the manpower to monitor that right now.”
That was Casey Kelley, Northwestern University, Feinberg School of Medicine, speaking to US News & World Report. In May.
Kelley identified the stress on the testing system as another reason for the lower-than-global report.
In order to be considered recovered by the Centers for Disease Control and Prevention, a person must be free of a fever without the help of medication, show improvement in respiratory conditions and receive negative results from two separate tests performed at least 24 hours apart.
And there you have it.
Sections (no jump links, sorry!)
1, Around the country; 2, Around the world; 3, Politics, economics and COVID-19; 4, Case count; 5, What you can do and resources
⓵ Around the country
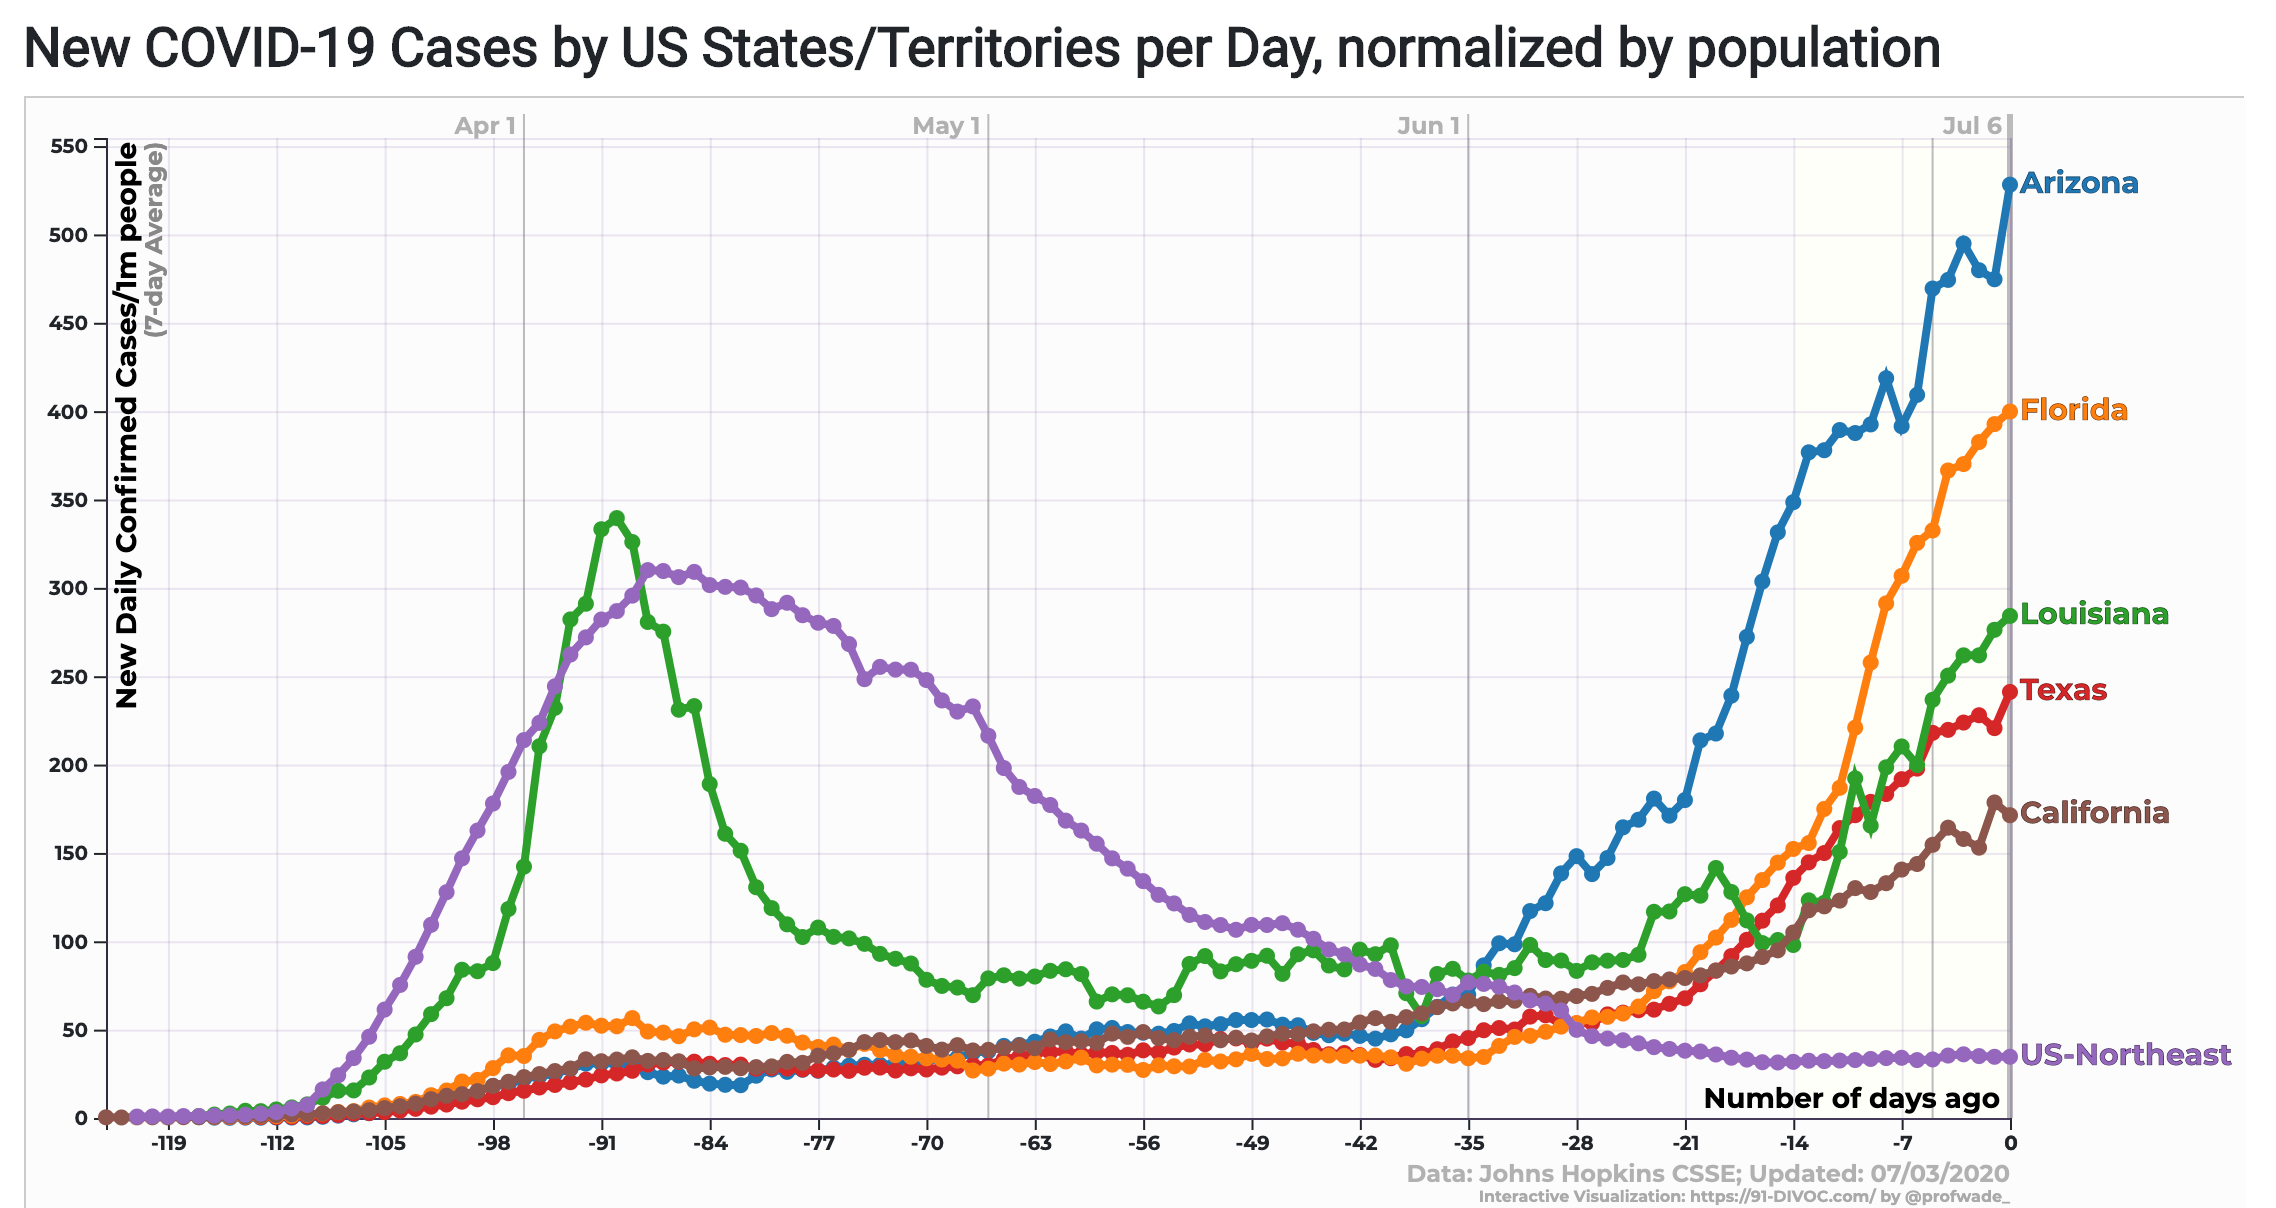
Cases in the south and west continue their meteoric rise.
As you can see from these charts (per capita), Arizona, Florida and South Carolina - individually - have a larger per capita case rate than the Northeast did. And when COVID-19 hit the Northeast, the US federal government had only just begun testing for community spread.


⓶ Around the world
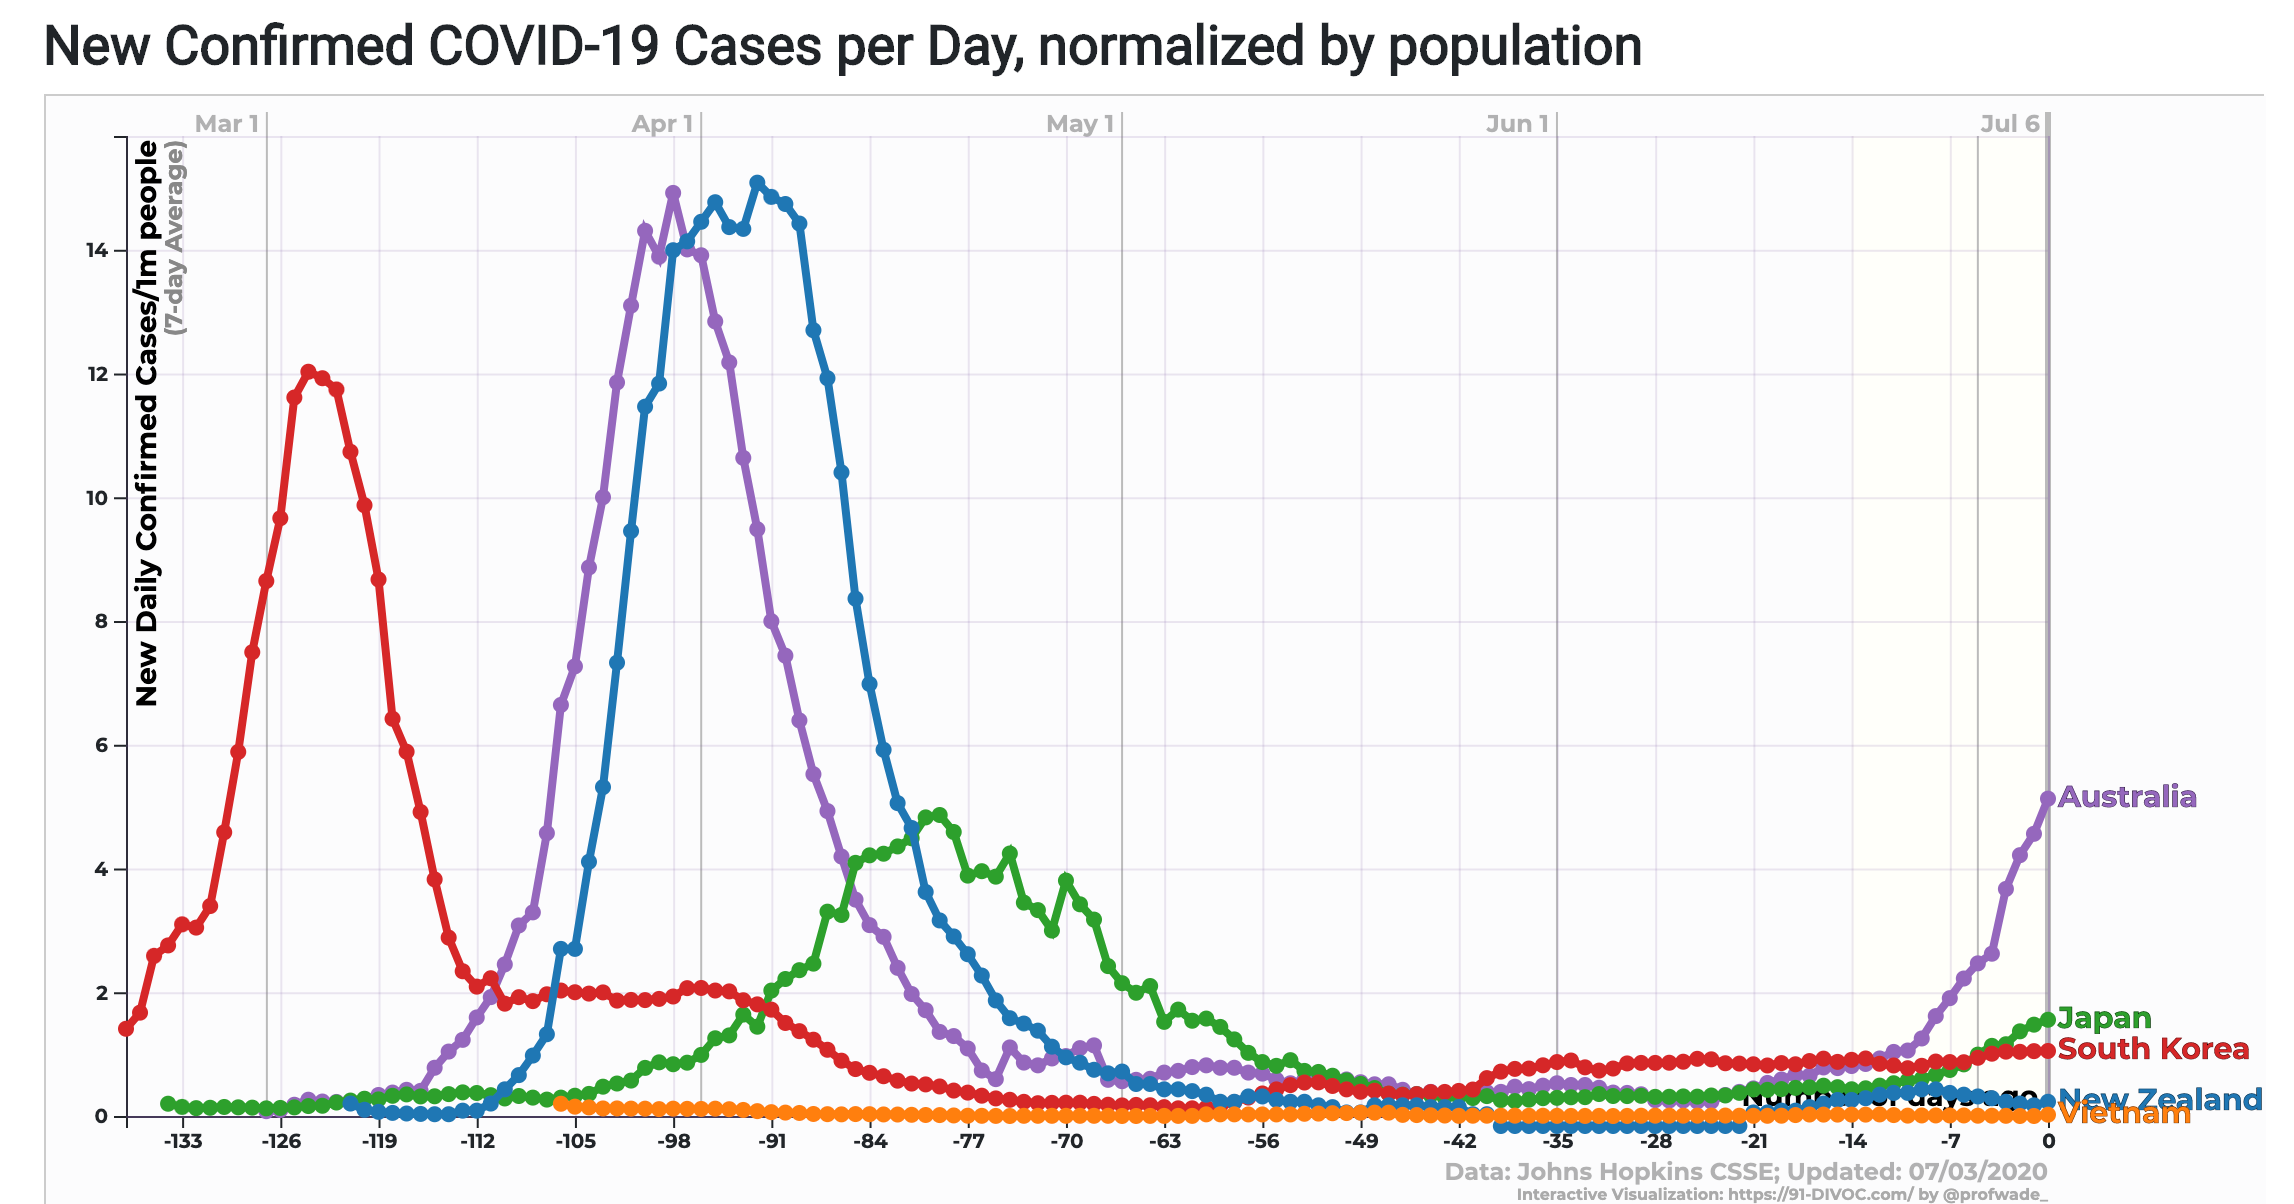
Two western countries, three Asian ones. Maximum number of cases per day (per capita, seven-day rolling average): 15. A reminder that Vietnam has had no deaths. And Australia’s second largest state, Victoria, has re-imposed a six-week lockdown. Their seven-day per capita average is less than 10; total new cases reported Tuesday morning: 191.
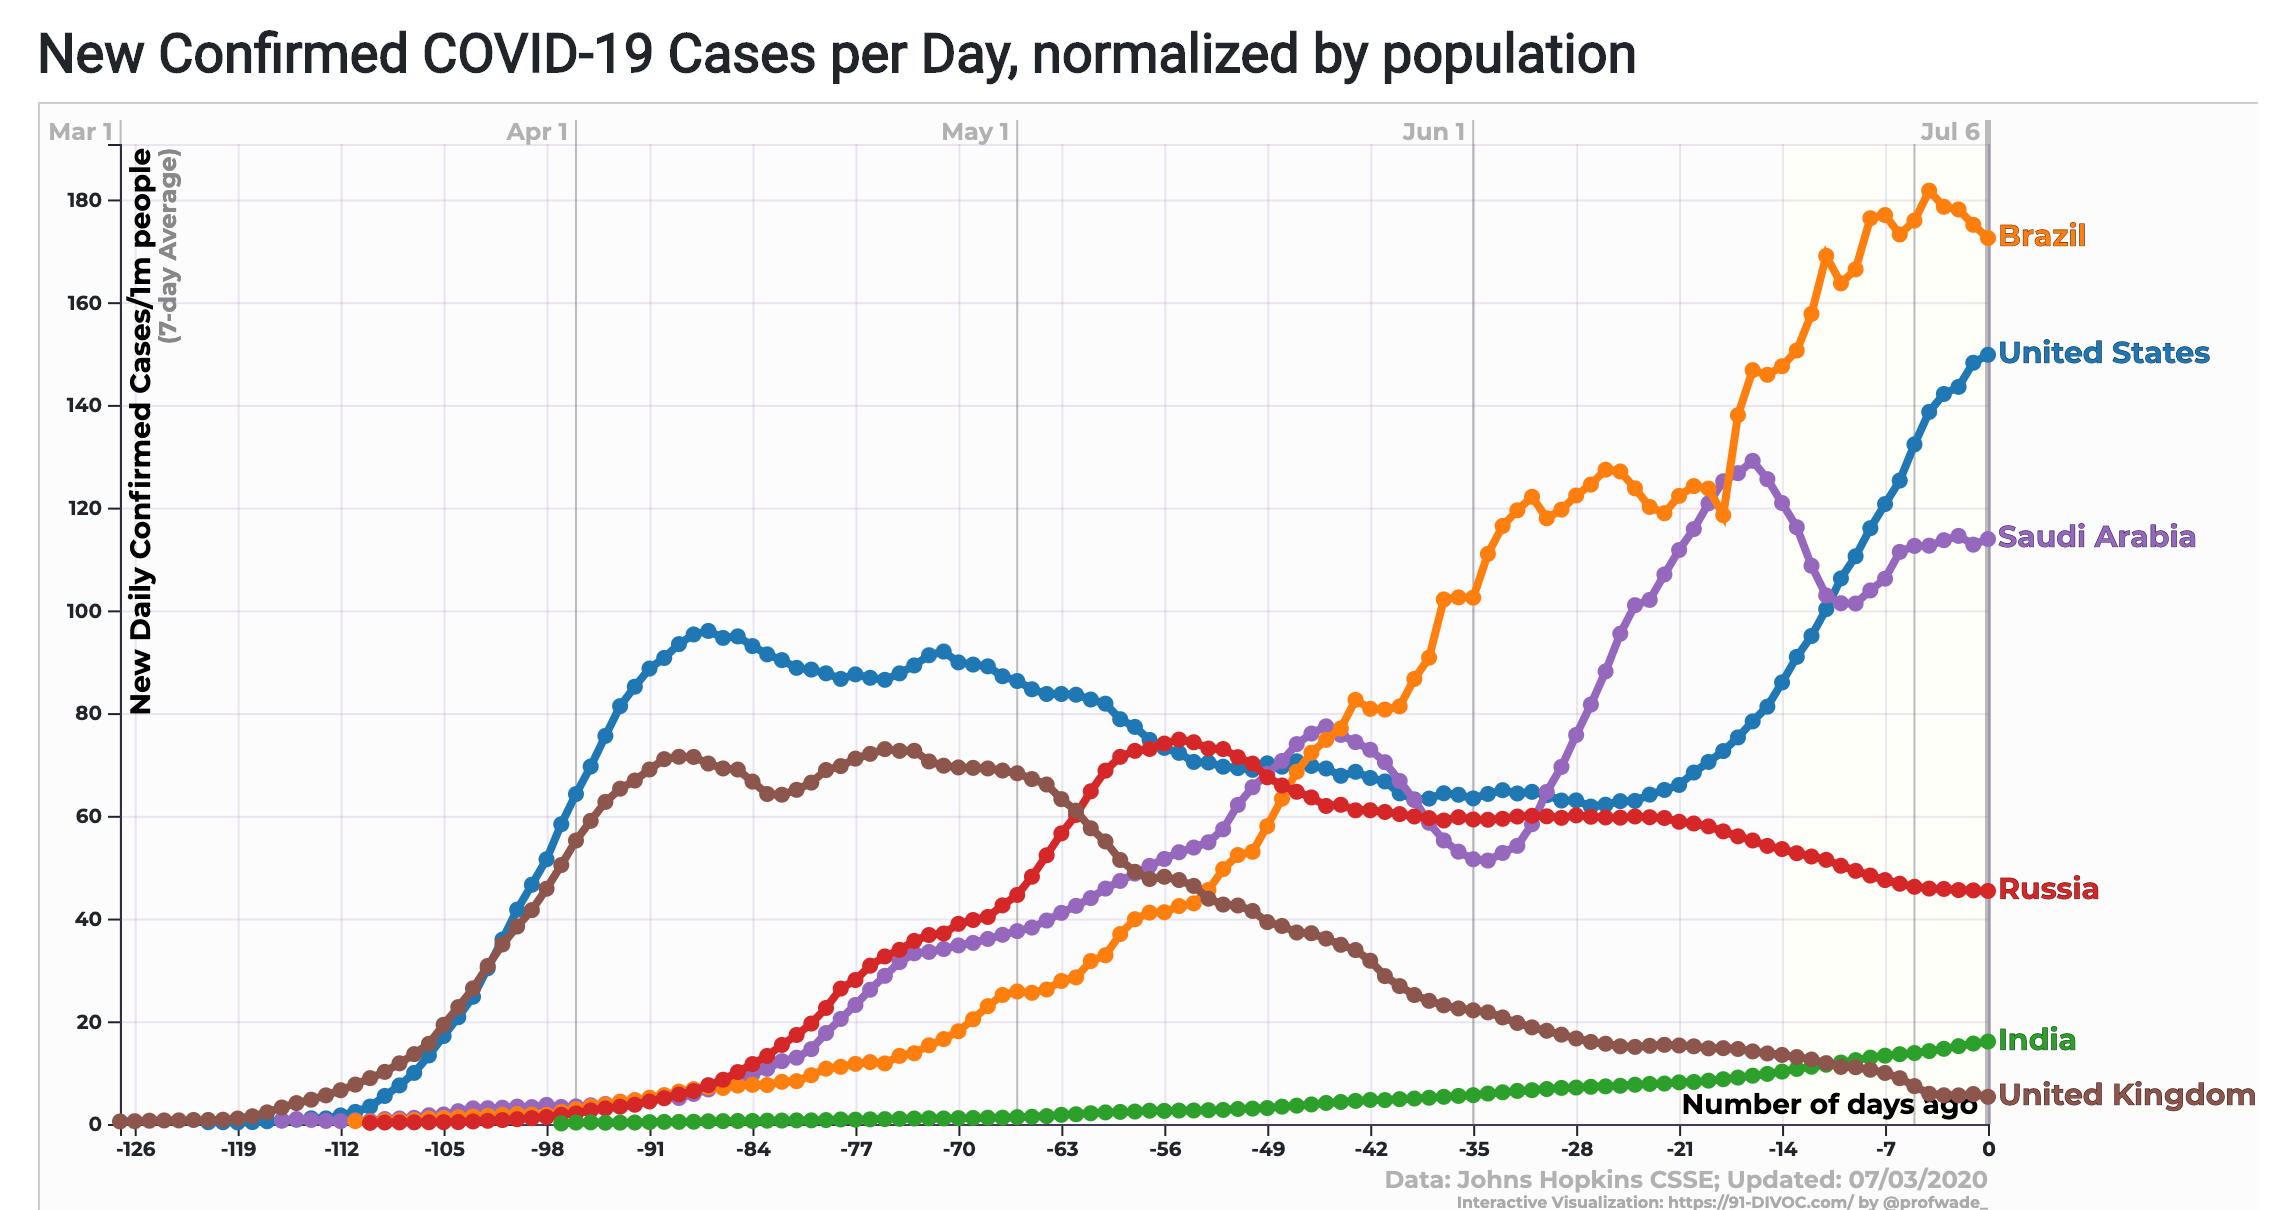
Contrast that with these countries, where the per capita rates have not peaked (Brazil, US and India).
⓷ Politics, economics and COVID-19
U.S. Immigration and Customs Enforcement (ICE) has ruled that international students cannot to stay here if their classes this fall are online only.
On Monday, the federal Student and Exchange Visitor Program announced, “The U.S. Department of State will not issue visas to students enrolled in schools and/or programs that are fully online for the fall semester nor will U.S. Customs and Border Protection permit these students to enter the United States."
“Active students currently in the United States enrolled in such programs must depart the country or take other measures, such as transferring to a school with in-person instruction to remain in lawful status,” the announcement said. “If not, they may face immigration consequences including, but not limited to, the initiation of removal proceedings.”
⓸ Case count
There is a lag between being contagious and showing symptoms, between having a test and getting its results. There is also a lag in reports of cases and deaths making their way into daily results; this lag is visible in predictable declines for both reports containing weekend data.
🌎 06 July
Globally: 11 327 790 cases (202 545) 532 340 deaths (4 134)
The Americas: 5 820 840 cases (122 886) 265 024 deaths (2 486)
US: 2 833 552 cases (57 186 new) with 129 408 deaths (182 new)
Johns Hopkins interactive dashboard (11.00 pm Pacific)
Global confirmed: 11,622,741 (173,034)
Total deaths: 538,079 (3,812)
Recovered: 6,302,689 (123,683)
🇺🇸 06 July
CDC: 2,886,267 (44,361 new) cases and 129,811 (235 new) deaths
Johns Hopkins*: 2,936,077 (47,442 new) cases and 130,306 (359 new) deaths
State data*: 2,928,524 (46,836 new) identified cases and 122,916 (237 new) deaths
KS reports only M-W-F; RI reports only M-F; no updates from RI todayTotal tests (US, Johns Hopkins): 36,032,329 (xxx)
Take with a grain of salt. Tests not necessarily people. The CDC and at least 11 other states have combined the data for active infections with data for antibodies, boosting total number of tests which can drop the percentage who test positive.
📣 View weekly state infographics
* Johns Hopkins data, ~11.00 pm Pacific.
State data include DC, Guam, the Northern Mariana Islands, Puerto Rico and the US Virgin Islands
The virus was not created in a lab and the weight of evidence is it was not released intentionally. Although early reports tied the outbreak to a market in Wuhan, China, analyses of genomic data in January suggested that the virus might have developed elsewhere.
⓹ What you can do
Stay home as much as possible, period.
Wear a mask when near non-family members.
Digestive problems may be a symptom.
Resources
👓 See COVID-19 resource collection at WiredPen.
📝 Subscribe to Kathy’s COVID-19 Memo :: COVID-19 Memo archives
🦠 COVID-19 @ WiredPen.com
📊 Visualizations: US, World
🌐 Global news (at WiredPen)