COVID-19 day 105 : 📈 1,180,634 cases; 68,934 deaths : 04 May 2020
Most states have either reopened or are in the process of reopening, and they have 15 of the top 25 local hotspots; a major leak from the Trump Administration models a dramatic daily death ⬆️by June
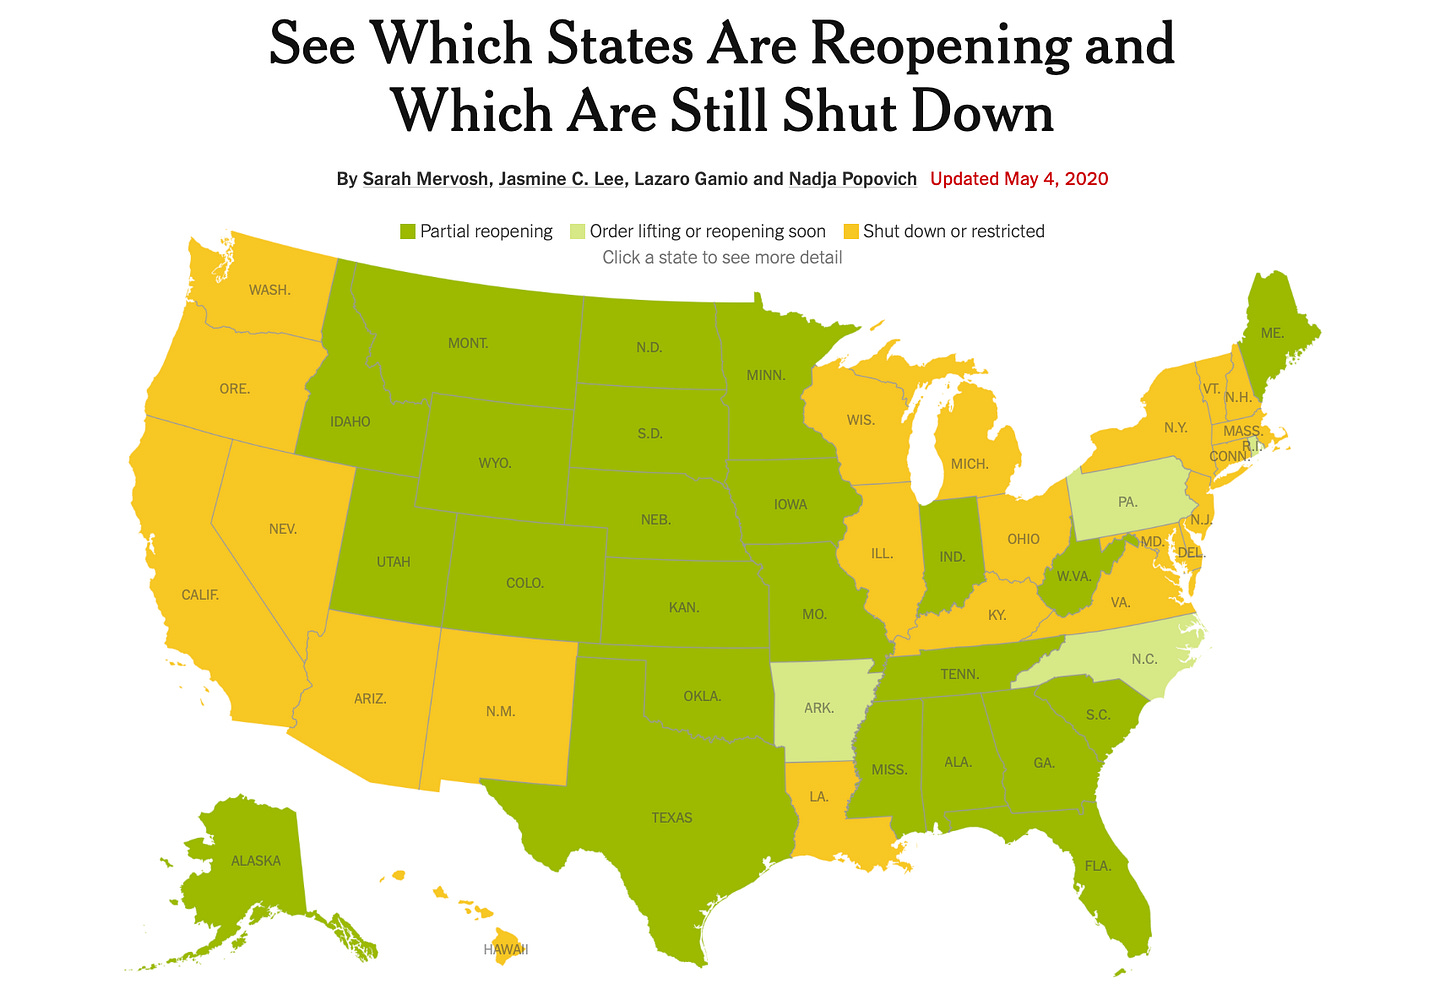
It’s day 105 since the first case of coronavirus disease was announced in the United States. As you can see from the chart, there are a lot of governors who have lifted their finger off the pause button. This is the “tell me more about those states” edition as well as commentary on the leaked Department of Homeland Security document in the NY Times.
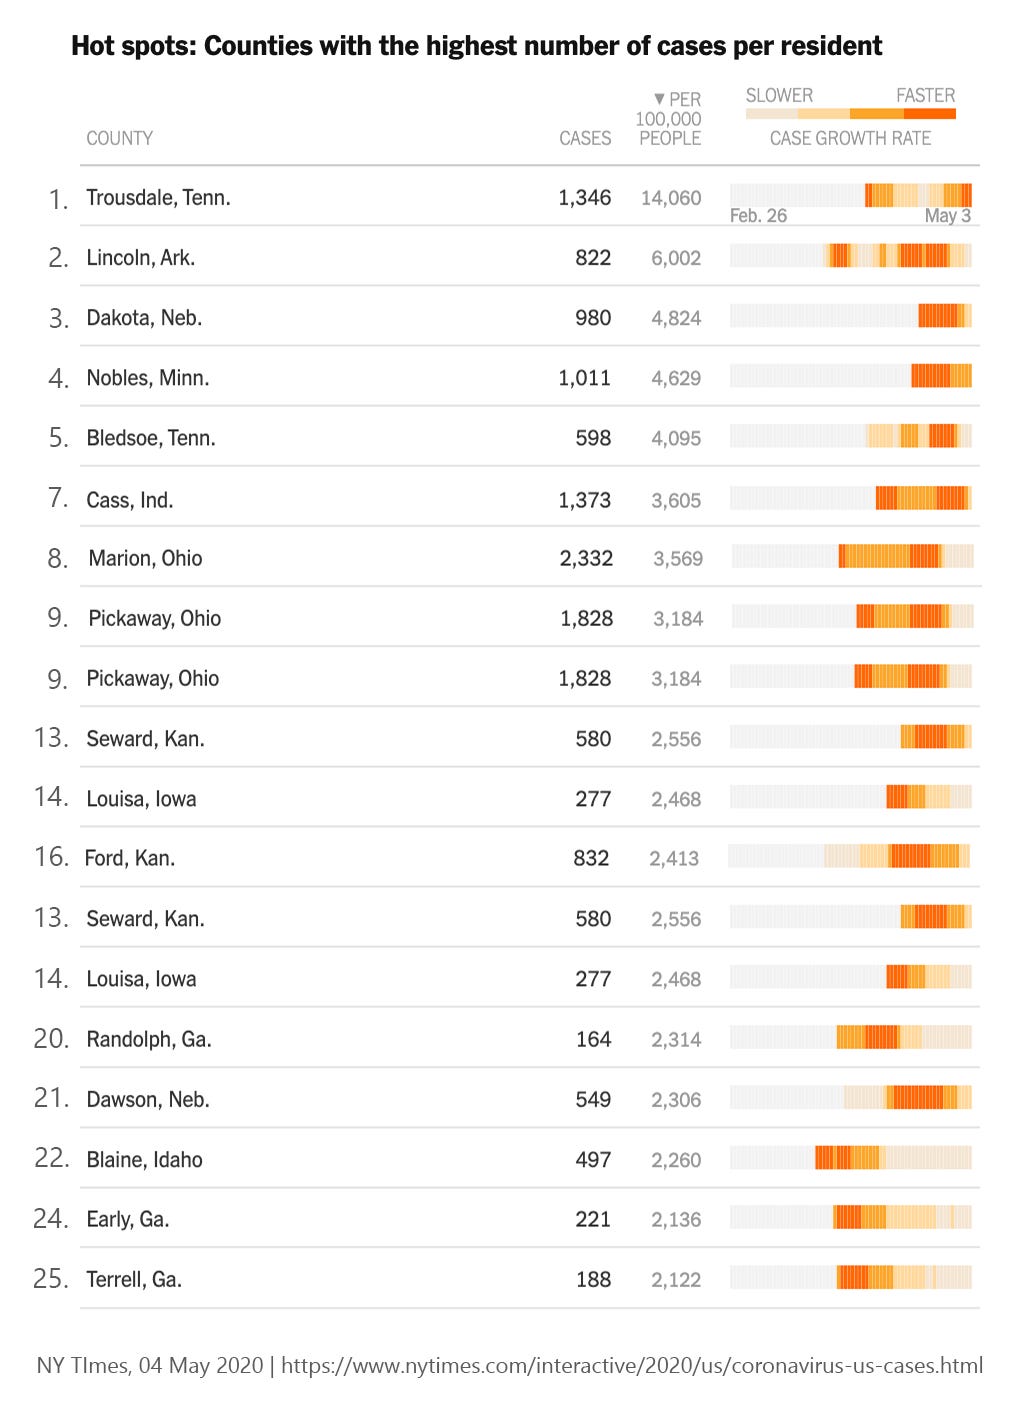
Today’s list of top county hotspots shows that of the top 25 which are growing faster than average, 15 are in states that are opening up: Arkansas, Idaho, Indiana, Iowa, Kansas, Minnesota, Nebraska and Tennessee.
The three Georgia hotspots have slowed; Georgia is open.
Three Ohio hotspots are slowing; Ohio is not opening.
One Idaho hotspot is slowing; Idaho is open.
I’ve removed NY and NJ because their growth has stopped and both states remain closed.
Of the 28 states that are opening:
For seven, the daily case rate is rising: Iowa, Indiana, Kansas, Minnesota, Nebraska, North Carolina and Wyoming
For 16, the daily case rate has plateaued: Alabama, Colorado, Florida, Georgia, Maine, Missouri, Mississippi, North Dakota, Oklahoma, Pennsylvania, Rhode Island, South Carolina, Tennessee, Texas, Utah and West Virigina
For five, the daily case rate is declining: Alaska, Arkansas, Idaho, Montana and South Dakota
Of the 22 states and District of Columbia that are not:
For seven, the daily case rate is rising: Arizona, Illinois, Maryland, New Hampshire, New Mexico, Virginia and Wisconsin
For 12, the daily case rate has plateaued: California, Connecticut, DC, Delaware, Kentucky, Massachusetts, Michigan, New Jersey, Nevada, Ohio, Oregon and Washington
For four, the daily case rate is declining: Hawaii, Louisiana, New York and Vermont
Finally, what about state party leadership?
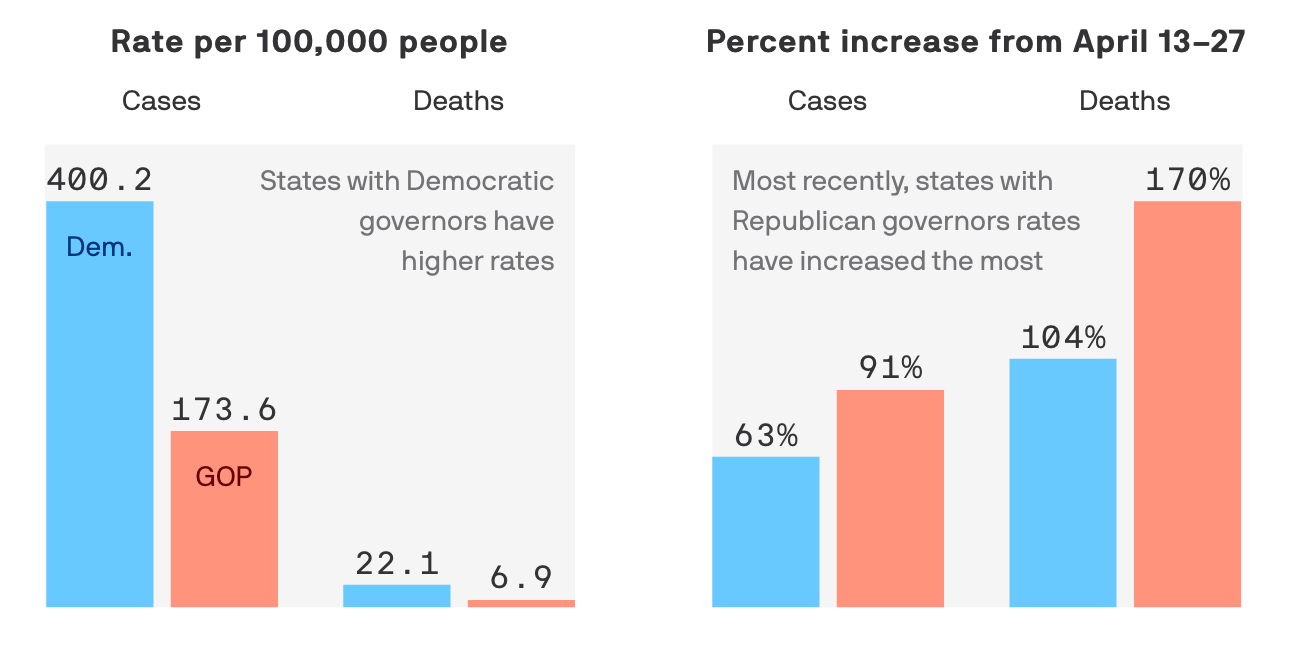
From Axios: the number of coronavirus cases is now increasing more quickly in states led by Republican governors.
Reported infections have increased 91% in red states but only 63% in blue states; remember, you have to test in order to have these rates rise
Death rates are even more starkly different: 170% growth in red states vs. 104% in blue states. This will undoubtedly be more divergent in a month.
🦠Monday, Johns Hopkins reported 1,180,634 (1,158,041) cases and 68,934 (67,682) deaths in the US, an increase of 1.95% and 1.85%, respectively, since Sunday. A week ago, the daily numbers increased by 2.3% and 2.49%, respectively.
The seven-day average: 22,593 (24,972) cases and 1,813 (2,026) deaths
That case rate is 356.68 per 100,000; the death rate is 20.83 per 100,000.
One week ago, the case rate was 298.62 per 100,000; the death rate, 16.99 per 100,000.
‼ About Sunday’s alarming and unexplained jump in the WHO reported deaths (5,000 new deaths). Someone in the US apparently screwed up. Consequently, today’s reported deaths is -1696.
United States of America data retro-adjusted by national authorities.
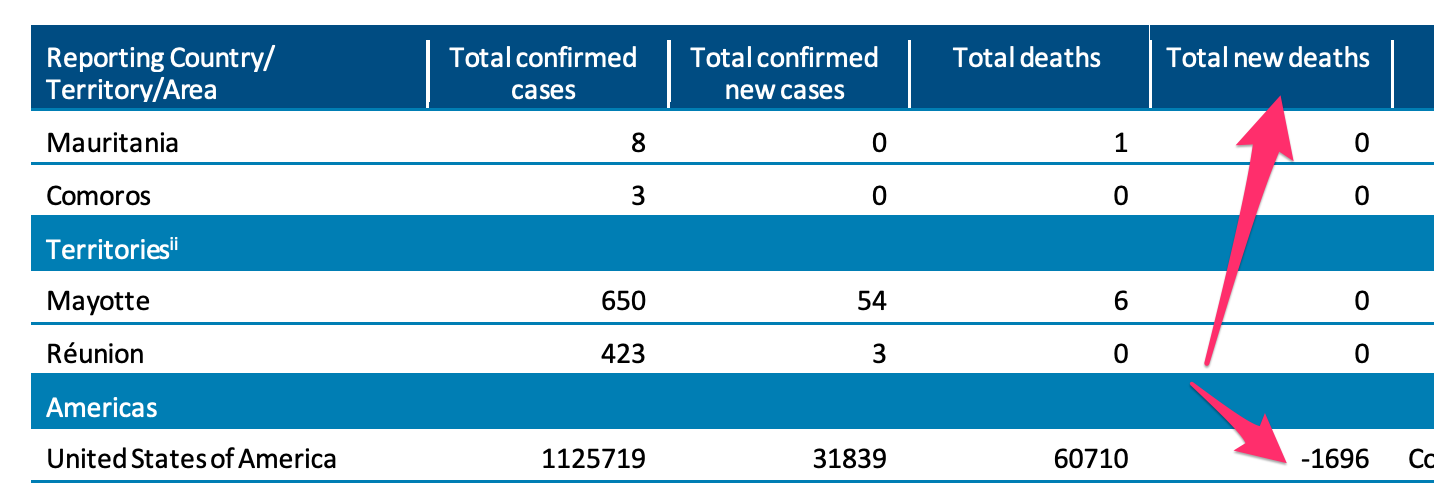
Due to the recent trend of countries conducting data reconciliation exercises which remove large numbers of cases or deaths from their total counts, WHO will now display such data as negative numbers in the “new cases” / “new deaths” columns as appropriate.
Please take a moment and answer this short reader survey! ✅
🤓Recommended reading
Contact tracing, explained. The US needs tens of thousands of “disease detectives” to safely reopen the economy. Vox, 04 May 2020.
This year April was death…hope … cruel. Washington Post, 02 May 2020.
April was death. Bodies stacked, mothers and fathers discarded in bags piled onto refrigerator trucks in hospital parking lots, dumped into mass graves. People leaving this life without farewells, without a last look of love, without a touch.
April was hope. A frenzy of purposeful energy, scientists and doctors and nurses searching for patterns that might lead to answers. People without fancy degrees snapped on gloves, tied on masks and prayed that the help they gave to people they would never know might not lead also to their own demise.
April was cruel. There have been worse months in the history of human beings, but not many. An average of 446,000 people died each month from August to October in 1942 during Germany’s mania of industrialized murder, the Holocaust. In the United States, the deadliest month was October 1918, when about 200,000 people succumbed to the flu.
⓵ Around the country
On Monday, California Governor Newsom said the state would move into its next stage of re-opening on Friday.
New York City is handing out free face coverings.
Faced with 20,000 coronavirus deaths and counting, US nursing homes are pushing back against a potential flood of lawsuits with a sweeping lobbying effort to get states to grant them emergency protection from claims of inadequate care.
At least 15 states have enacted laws or governors' orders that explicitly or apparently provide nursing homes and long-term care facilities some protection from lawsuits arising from the crisis. And in the case of New York, which leads the nation in deaths in such facilities, a lobbying group wrote the first draft of a measure that apparently makes it the only state with specific protection from both civil lawsuits and criminal prosecution.
California: On Saturday, a man wore a Ku Klux Klan hood while shopping at a regional grocery store in Santee (San Diego County). On Friday, San Diego County began mandating that residents wear face coverings in public.
The Los Angeles Times notes that the city has a history of racially motivated attacks and is known by the nicknames “Klantee” and “Santucky.”

All 50 states, the District of Columbia, Guam, the Northern Mariana Islands, Puerto Rico and the US Virgin Islands have identified COVID-19 cases and all have at least one death.
⓶ Around the world
Japan is extending its nationwide state of emergency through the end of May, on the advice of health experts.
… the rise in new cases has slowed but Japan’s medical system is still overburdened.
… current measures in Tokyo and a dozen other prefectures designated as special warning zones are expected to stay in place, while 34 other prefectures would be allowed to somewhat ease restrictions on the condition they take ample preventive steps.
The UK is testing a contact tracing app that is similar to one used in South Korea: it advises a user if they come in contact with a person who has tested positive. This requires a robust testing infrastructure; there are privacy concerns.
The number of affected countries/territories jumped from 29 at the end of February to 187 today. Although early reports tied the outbreak to a seafood (“wet”) market in Wuhan, China, analyses of genomic data suggest that the virus may have developed elsewhere.
⓷ Politics, economics and COVID-19
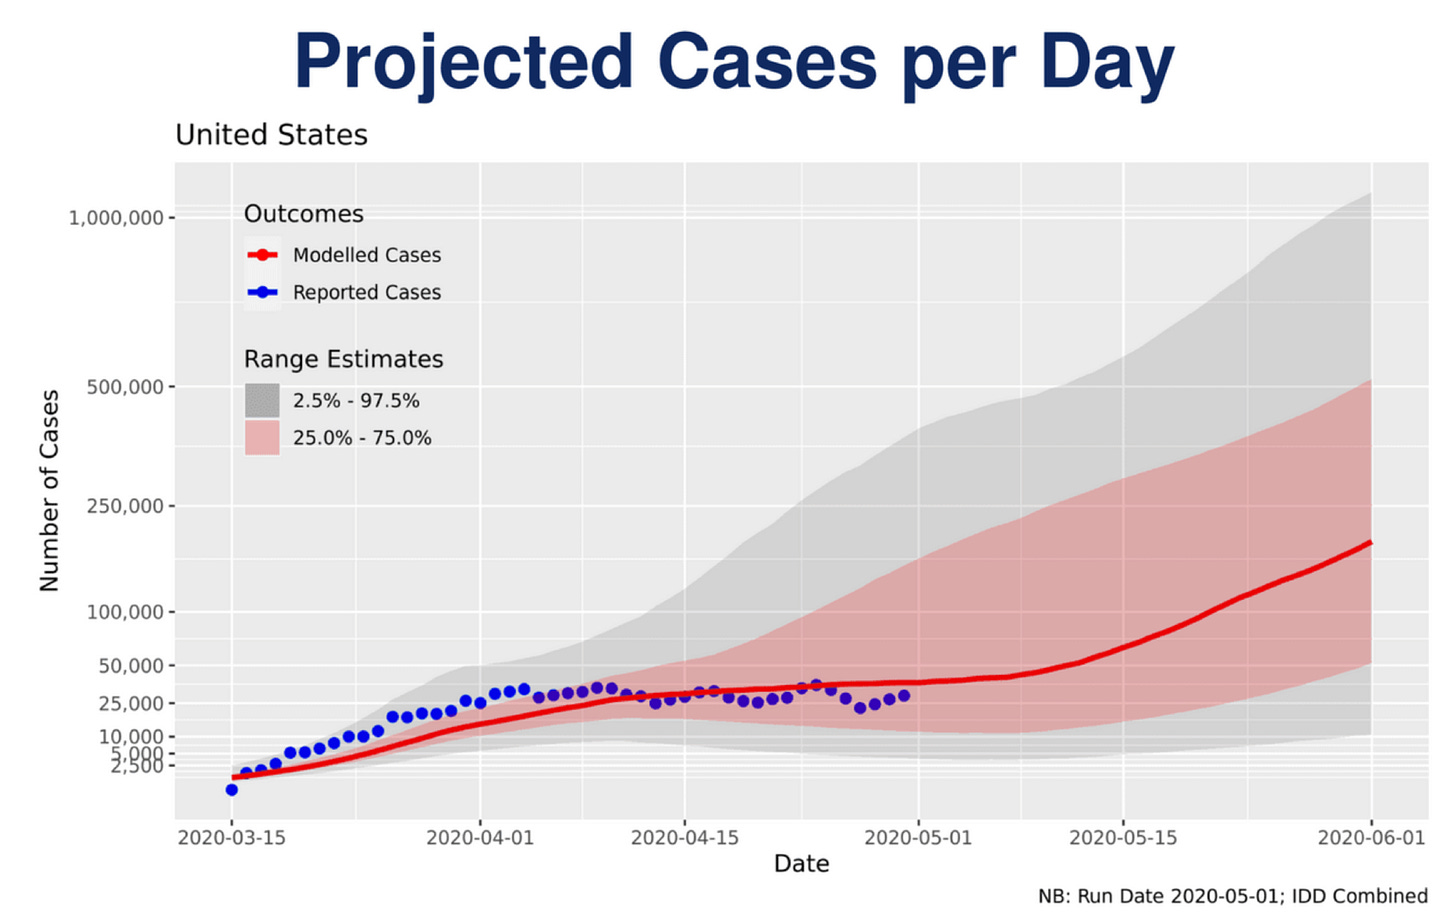
The news bomb today came from the NYTimes, which published an internal Trump Administration document. The Centers for Disease Control and Prevention Situation Update is dated 5/02/2020.
Some news reports focused on a prediction of an approximate 50% increase in daily deaths by the end of the month, from ~2,000 to ~3,000. Today’s seven-day average: CDC, 1,946; Johns Hopkins, 1,813.
The model used for cases is closely tracking the data. However, we are not testing robustly, nor do we know the assumption built into this model.
Nevertheless, the model predicts a rapid increase in cases per day from around 25,000 today to around 200,000 on 01 June. This would require an order-of-magnitude increase in the number of people being tested daily, unless we assume a higher positive rate.
However, the model used for deaths does not have a good track record.
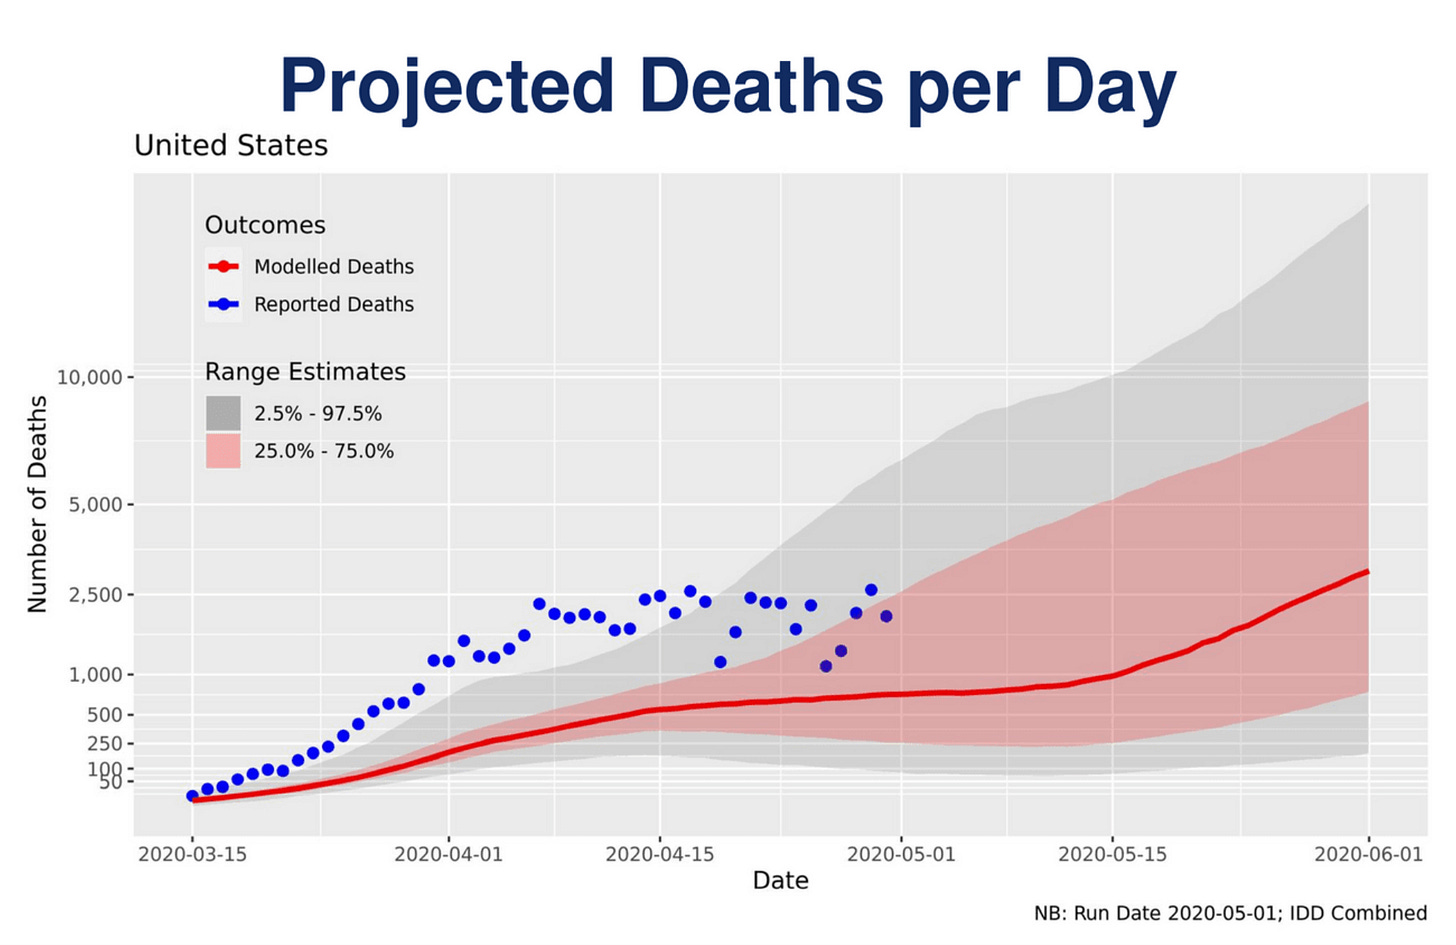
Until the second half of April, actual deaths were outside the broadest range of probability. We know that these data are probably underreported as well, due to the CDC’s own excess mortality data as well as the lower percentage of tests. About 1-in-4 deaths in April was “excess”, that is, outside of the modeling error for projected deaths.
If the model retains its inaccuracy, daily deaths could reach 5,000.
🦠The Institute for Health Metrics and Evaluation at the University of Washington has more than doubled its April 17 forecast, from 60,308 deaths by 04 August to nearly 135,000 deaths. Today’s death total from the CDC: 67,546. The model has been criticized by epidemiologists but is reportedly widely use by the White House.
🦠When per capita cases numbers are low, it could be because the virus has just started to infiltrate a community. However, if the ratio of deaths to cases is high, it suggests insufficient testing, especially with a disease where so many are asymptomatic (but can infect others).


⓸ Case count
There is a lag between being contagious and showing symptoms, between having a test and getting its results. The virus was not created in a lab.
🌎 04 May
Globally: 3 435 894 cases(86 108 - new) with 239 604 deaths (976* - new)
The Americas: 1 433 756 cases(49115 - new) with77 827 deaths (-582* - new)
* These low numbers are due to an adjustment in US data from 03 May.
Johns Hopkins interactive dashboard (11.00 pm Pacific)
Global confirmed: 3,584,118 (3,507,265 - yesterday)
Total deaths: 251,562 (247,491 - yesterday)
Recovered: 1,167,883 (1,127,887 - yesterday)
🇺🇸 04 May
CDC: 1,152,372 (1,122,486) cases and 67,546 (65,735) deaths
Johns Hopkins*: 1,180,634 (1,158,041) cases and 68,934 (67,682) deaths
State data*: 1,173,257 (1,152,006 (1,125,719) identified cases and 62,806 (61,868) deaths
Total tested (US, Johns Hopkins): 7,285,17 (7,053,366)
View infographic and data online: total cases and cases and deaths/100,000.
* Johns Hopkins data, ~11.00 pm Pacific.
State data include DC, Guam, the Northern Mariana Islands, Puerto Rico and the US Virgin Islands
⓹ What you can do
Stay home as much as possible, period.
Digestive problems may be a symptom.
Resources
👓 See COVID-19 resource collection at WiredPen.
📝 Subscribe to Kathy’s Daily Memo :: Daily Memo archives
🦠 COVID-19 @ WiredPen.com
🌐 Global news


